Friday 14 July 2017Te Whatu Ora Waitaha Canterbury News12 minutes to read
In response to information released by The Treasury under the Official Information Act, Sir Mark Solomon, Acting Board Chair, Canterbury DHB, issued the statement below
Overview
First off, let me be absolutely clear, there is complete commitment from Canterbury DHB management and the Board to continue to reduce our expenditure growth and bring the DHB back to financial sustainability. However, this is simply not achievable until after the new hospital is up and running.
Canterbury DHB was on track to report a budget surplus in 2010/11 pre-quake.
Post-quakes the Health Ministry did not have a post-disaster policy framework which would allow different ways of funding health services in a unique, ever-changing environment.
While population growth dipped immediately after the 2011 quakes, it has rapidly risen, exceeding Statistics NZ prediction series for the past four years. (Refer to Appendix 1: Statistics NZ Population predictions.)
Canterbury DHB has consistently sought a longer-term funding track, but this has not been forthcoming, hence the piece-meal [and seemingly uncoordinated approach] for additional funding to meet unanticipated needs such as the North Canterbury Quakes and extreme growth in Mental Health Demand.
Our position is not whether further reduction in expenditure can be achieved without disruption to patient care – it's a debate about when a further reduction can be achieved.
I agree with the factual statements in the Treasury document.
As identified in Figure 6. Canterbury DHB's share of the nation's per capita funding has declined, year on year for the last three years. Treasury has identified that Canterbury's total PBFF funding increased by 20.4 percent, compared to a national increase of 24.5%. I am happy to debate with the central agencies the appropriateness of that decline but it is interesting to note that the size of the Canterbury DHB deficit almost exactly matches the gap between its current share of funding and pre-quake share of funding.
It's also worth noting that if Canterbury had received the national average funding increase then the Government wouldn't have needed to deficit-fund the DHB.
As identified in Figures 8 to 14 Canterbury's performance compares favourably with other DHBs and is as good, better or in the case of aged care, rapidly improving. All of these improvements contribute to the long-term sustainability of Canterbury DHB. For example the improvement in aged care admissions has contributed a bottom-line financial gain in excess of $15 million per annum. These outcomes are as a result of deliberate strategies implemented by our senior management and clinical teams, which makes the claim that the management and clinical teams are not paying attention to financial sustainability hard to understand.
Canterbury is one of the few hospital systems in the world that has been able to reduce occupied bed days, this is supported by Treasury Figures 11 to 13. We can also provide more effective measures of system activity that illustrate actual reductions in occupied bed days that are the equivalent of two to three wards of a hospital [that we don't need to resource].
This reduction in bed days does not only reduce operational expenditure it has also meant less capital expenditure as fewer beds have needed to be built – a saving to the Government of $100 million plus on 2010 bed projections. Again these improvements have been as a result of deliberate strategies to improve the quality of healthcare and address the clinical and financial sustainability of Canterbury DHB.
In the medium term Canterbury has plans to reduce the rate of its expenditure increase, which we wish to discuss with the central agencies (Pages 46 & 47 of the Treasury document.) However, while the disruption of the rebuild continues and the DHB remains constrained by its physical environment, in particular the lack of operating theatres, there is only so much that can be achieved in the short-term. In reality no health system can break even when it is commissioning a large and complex hospital build and no other DHB in New Zealand has ever been able to. Our position is not whether further reduction in expenditure can be achieved without disruption to patient care – it's a debate about when a further reduction can be achieved.
The release of these documents under the Official Information Act, without the courtesy of advance notice under agreed government protocols, and the fact they contain opinions that could possibly have been withheld under the Act, only serves to further undermine my confidence that Canterbury DHB is getting a fair hearing.
FACT: There is a growing gap between Canterbury's share of NZ's population and its share of health funding
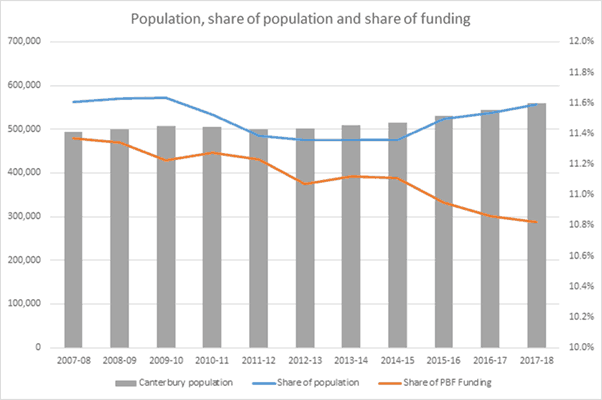
The Treasury OIA documents show that our relative share of funding has decreased (ref page 41 of 47)

(ref page 40)
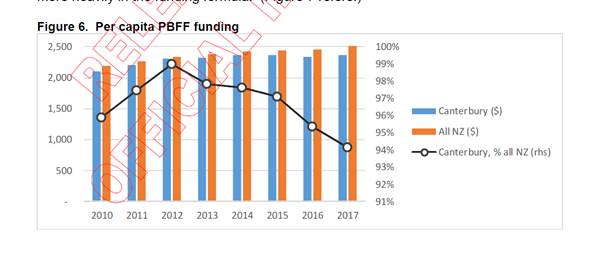
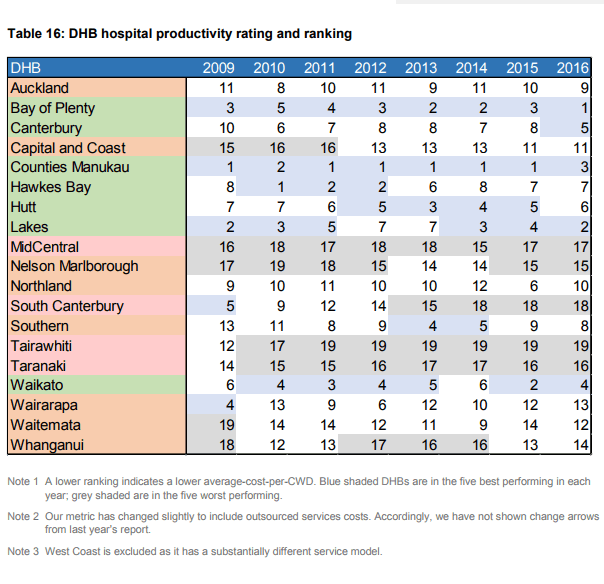
FACT: Canterbury DHB has made significant productivity gains
Canterbury DHB has improved its ranking from 10th (of 21 DHBs in 2009, to 5th of 20 DHBs in 2016 and within five percent of the best). This ranking is based on a range of measures. Many of these are covered in the information released by Treasury.
(Table 16 Reference: Treasury Report February 2017 District Health Board Financial Performance to 2016 and 2017 plans page 40)
FACT: Canterbury DHB scores ‘well' or ‘reasonably well' against most service and performance metrics. It is not an outlier (ref. page 41 of 47 Treasury OIA documents)
FACT: Canterbury DHB's rates of acute hospital admissions that could have been avoided through interventions delivered in non-hospital settings (ASH rates) are ‘average' for adults and ‘better than average' for children (ref page 42 of 47 Treasury OIA documents)
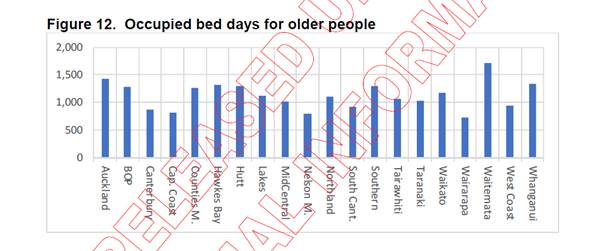
FACT: Canterbury DHB's quality of care for older people is scored highly, relative to most other DHBs (ref Figure 12. Occupied bed days for older people – page 43 of 47 Treasury OIA documents)
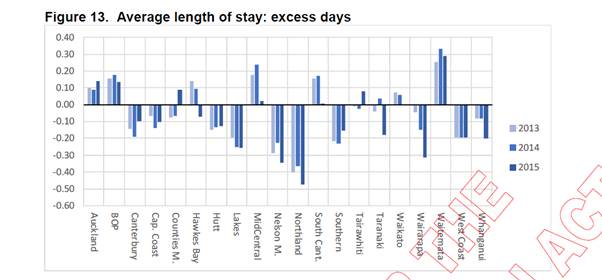
FACT: Canterbury DHB is one of the top performing DHBs in terms of average length of stay. (ref Figure 13. Average length of stay: excess days)
This is a way of measuring hospital efficiency. Note that Canterbury is the only large and/or tertiary DHB achieving good results in this measure with Capital and Coast being next best – the other high performers are smaller DHBs who refer their complex cases on.
FACT: Canterbury DHB has experienced unprecedented increases in demand for mental health services since the quake – it is a credit to the teams who have changed the way they work to ensure Canterbury people have access to services.
Contrary to Treasury analyst's comments on page 36 of 47, no other DHB that we are aware of has seen these types of increases in mental health referrals and the fact that Canterbury people are more able to access support as stated by Treasury doesn't negate the reality that there is higher need in the post-quake environment.
- 36 percent increase in adult community referrals
- 100 percent increase in child and youth
- 94 percent increase in adult rural
FACT: Canterbury DHB has taken the PWC reviews seriously
Since receiving the second PWC Review in December 2016, Canterbury DHB has worked closely with PWC to achieve the arbitrary 0.8 percent efficiency saving suggested, and this has been factored into our budget for next year.
Canterbury DHB also identified just over $12m of corrections to be made to the PWC financial modelling, which PWC have acknowledged.
It's important to note that PWC didn't say Canterbury DHB could break even– they took the Ministry of Health advice that it was possible – and none of their modelling suggested it could be achieved in two years.
The Stage 2 PWC Report demonstrated that Canterbury DHB is containing its expenditure growth – in fact in many areas it is lower than comparable DHBs – another indication that we take seriously, and are determined to live within our means.
In the documents released by The Treasury Page 41 of 47: ‘Canterbury's level of external (non-hospital) expenditure is about average. This indicates a reasonable level of priority is given to non-hospital services, given that this is a large tertiary centre. In common with many other DHBs, Canterbury has reduced the proportion of expenditure devoted to non-hospital services in recent years.'
Further, given the concerns of the Board and our stakeholder Ministers, the Acting Board Chair wrote to Treasury seeking a joint cross-agency working party to work with Canterbury DHB to “determine a real and pragmatic way forward”. Invites into the meeting include Treasury, the Department of Prime Minister and Cabinet, the State Services Commission and Ministry of Health to work together and discuss Canterbury DHB's finances, facilities, future funding and mental health pressures. (refer to letter from Mark Solomon: pages 46 & 47 of the Treasury OIA documents)
FACT: Canterbury DHB's Board and Management team don't agree on everything – but we do share a common goal – to do the best for our community and our health system.
Before I joined the Board as Deputy Chair, I had an open mind as to the competency – or otherwise of the Canterbury DHB leadership team and clinicians – however, as time has gone on I have been nothing but impressed by the knowledge, skills, care and capacity of those working in the Canterbury Health System.
I have total confidence in the Chief Executive and management team – I think the public would be surprised to learn how hard and long, this team works alongside all of the other dedicated people in the health system to ensure the people of Canterbury continue to have access to the services they need.”
Analysts based in Wellington haven't sat down with the Board or the executive team or the clinicians in an attempt to understand the challenges Canterbury is facing.
I would suggest they walk a mile in our shoes before making assumptions.
There is a trail going right back to 2013 where Canterbury has raised specific concerns about the risks and challenges of running a health system with broken buildings, tired staff and an emerging population mental health issue – not to mention a large rebuild population that attracted no funding but put more pressure on a damaged infrastructure.
Appropriately these issues were not raised in the media but directly with central agencies. These issues have emerged over time due to the Official Information Act, not through some media strategy adopted by the Board.
Interestingly, the same Act has now provided further insight as to the quality and bias of the advice received by Ministers. Advice provided without any discussion with the team on the ground who have kept this system performing since 2011.
In a recent OIA released by the Treasury, one of their officials states the following when referring to a ‘revised briefing' about Canterbury DHB:
‘The way this briefing is written reinforces the corporate centre isn't open to an evidence base. This is an inconvenient fact. There is a bias in the briefing that suggests a little capture of the Ministry's perspective – we should acknowledge that bias as that is where we (Treasury) have the ongoing relationship'
Ref: Treasury OIA 20170052 TOIA Binder S1 S2 Doc 14 Page 57 of 87
The team in Canterbury do not want to be deficit funded they asked from the beginning for a stable funding path that grew at New Zealand average and subsequent analysis shows that would have been sufficient.”
FACT: Of the $1.4 billion Canterbury DHB receives, only nine percent is discretionary spending. The rest is tagged to certain services and initiatives by the Ministry of Health. This includes mental health ‘ring fence funding', elective surgery funding, screening programmes etc.
Canterbury DHB is not resiling from the need to reduce expenditure. We have simply stated that we cannot make such significant reductions until the new hospital and operating theatres are up and running.
FACT: Canterbury’s population of older people is not growing slower than the rest of the country
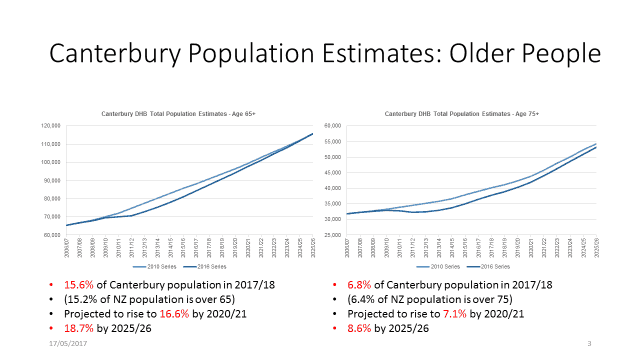
The latest population projection series [data] from Statistics NZ (December 2016 update) shows Canterbury's 65+ population is not growing slower than the country as a whole – within that series, our population grows by 3.9 percent from 16/17 to 17/18, compared to 3.7 percent for NZ. By 2025/26 the 65+ population grows 32 percent, compared to 31 percent overall.
It appears Treasury is comparing the 65+ funded population from 16/17 (Dec15 series) to the funded population for 17/18 from the Dec 16 series, which gives a 2 percent increase year on year, compared to 2.2 percent nationally. However the stats assumptions in their model seem to have significantly rebased the 65+ population and every DHB has a smaller population in the 16/17 year in the Dec 16 projection series than in the Dec 15 series.
Canterbury DHB asserts that it is not correct – or accurate – to compare population growth over time from different projection series as Treasury appear to have done.
Appendix 1
FACT: Canterbury DHB's population has not been ‘over-estimated year on year' nor does it have ‘relatively few Māori and Pasifika' people (ref Page 38 of 47)
The Slides below are compiled using data provided by Statistics NZ and used for population-based funding each year.
There are more Māori people in Canterbury than the total populations for West Coast (32,600), Wairarapa (44,135) and Tairawhiti (48,430). Canterbury's Pasifika population is such that Canterbury meets the threshold to be classed a ‘Pacific DHB'.
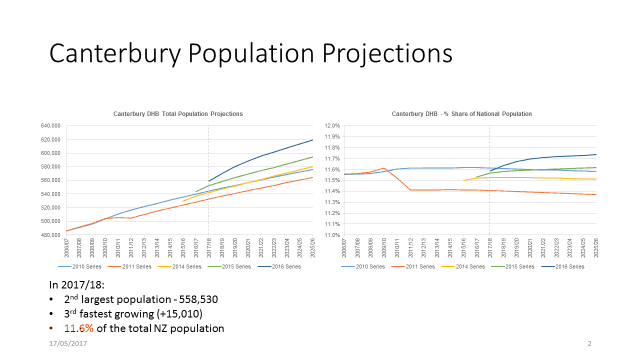

Canterbury has the sixth largest Maori population for 2017/18:
| DHB_name |
Maori Pop 2017_2018 |
Rank |
| Waikato |
93,720 |
1 |
| Counties Manukau |
88,150 |
2 |
| Waitemata |
61,350 |
3 |
| Northland |
60,220 |
4 |
| Bay of Plenty |
57,860 |
5 |
| Canterbury |
51,630 |
6 |
| Hawkes Bay |
42,860 |
7 |
| Auckland |
42,390 |
8 |
| Lakes |
37,950 |
9 |
| Capital and Coast |
35,730 |
10 |
| MidCentral |
35,240 |
11 |
| Southern |
32,790 |
12 |
| Hutt |
25,620 |
13 |
| Tairawhiti |
24,510 |
14 |
| Taranaki |
22,790 |
15 |
| Whanganui |
16,950 |
16 |
| Nelson Marlborough |
15,610 |
17 |
| Wairarapa |
7,880 |
18 |
| South Canterbury |
5,090 |
19 |
| West Coast |
3,920 |
20 |
Appendix 2
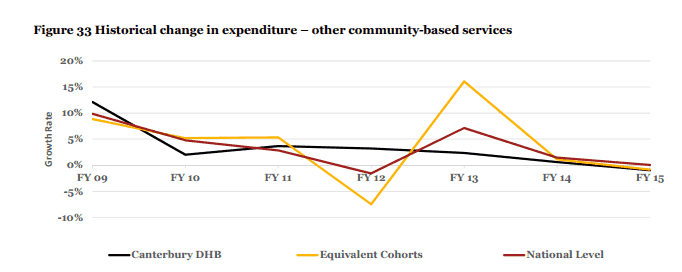
FACT: The PWC stage 2 financial review of Canterbury DHB demonstrated that Canterbury's expenditure growth is lower than comparable DHBs.
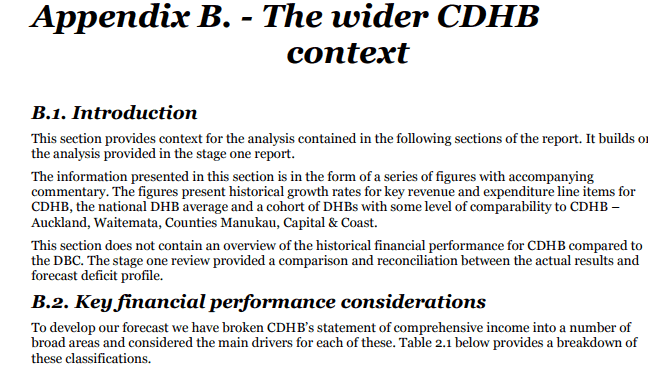
The graphs below are taken from Appendix B of the PWC Review. They demonstrate that Canterbury DHB has been consistently reducing its expenditure – we know there is more we can do once our new facilities and operating theatres are up and running.
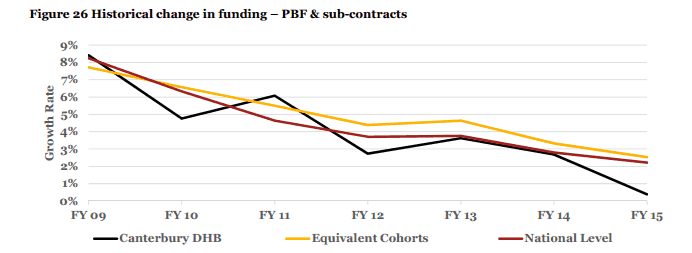
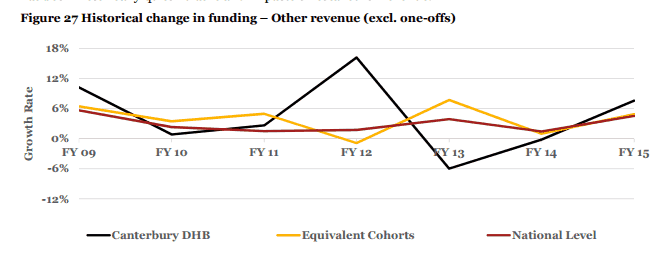
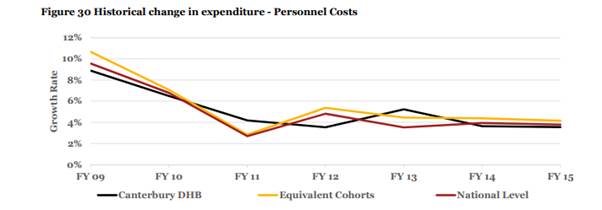
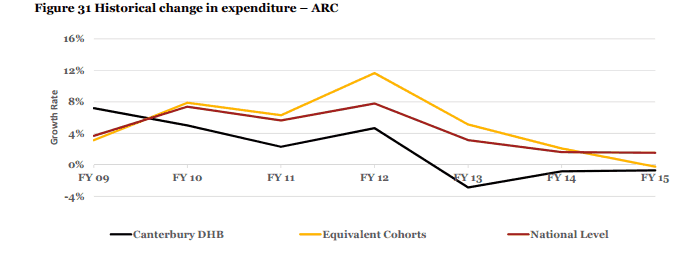
ARC is Aged Residential Care
Downloads available
Canterbury DHB Response to Treasury OIA Documents (PDF, 1MB)
Back to Health News


