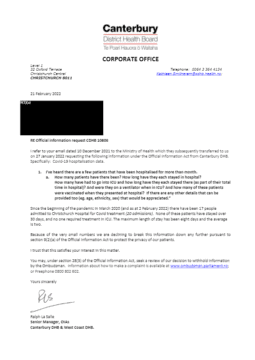
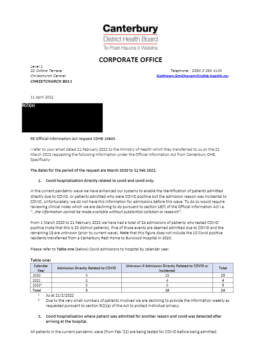
I've heard there are a few patients that have been hospitalised for more than month.
If there are any other details that can be provided too (eg. age, ethnicity, sex) that would be appreciated.
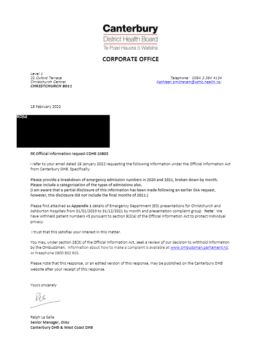
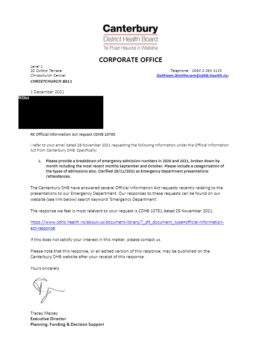
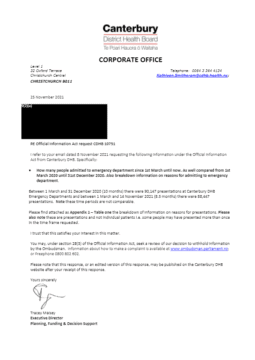
Please provide a breakdown of all emergency admission (presentations) numbers in 2020 and 2021, broken down by month. Please include a categorisation of the types of admission (presentation) also.
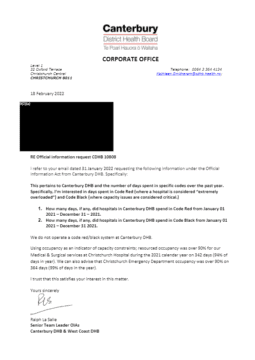
Number of days hospitals spent in 'Code Red' and 'Code Black' 2021 calendar year (Jan-Dec).
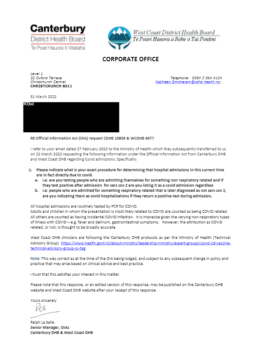
Please indicate what is your exact procedure for determining that hospital admissions in this current time are in fact directly due to Covid-19.
i.e. are you testing people who are admitting themselves for something non respiratory related and if they test positive after admission for sars cov 2 are you listing it as a covid admission regardless ?
i.e. people who are admitted for something respiratory related that is later diagnosed as not sars cov 2, are you indicating them as covid hospitalisations if they return a positive test during admission.
ED / Emergency Department admissions 2020 and 2021 broken down by month and types of admissions.
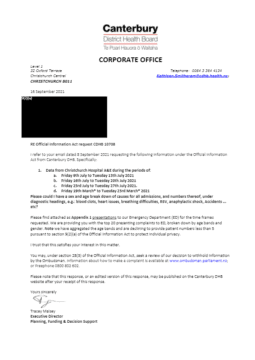
Data from Christchurch Hospital A&E during the periods of A) Friday 9th July to Tuesday 13th July 2021 B) Friday 16th July to Tuesday 20th July 2021 C) Friday 23rd July to Tuesday 27th July 2021. D) Friday 19th March* to Tuesday 23rd March* 2021.
Please could I have a sex and age break down of causes for all admissions, and numbers thereof, under diagnostic headings, e.g.: blood clots,heart issues,breathing difficulties,RSV,anaphylactic shock,Accidents
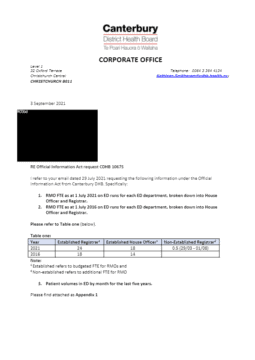
RMO FTE on ED runs 2016 and 2021, ED patient volumes last five years, ED presentations January and June 2021 by time band and day.
Showing 1-10 of 10 results, page 1 of 1.
Page last updated: 28 April 2022
Is this page useful?